
Bank Multifamily Charge-Offs Doubled in 2026 Even as Headline Delinquency Rate Fell

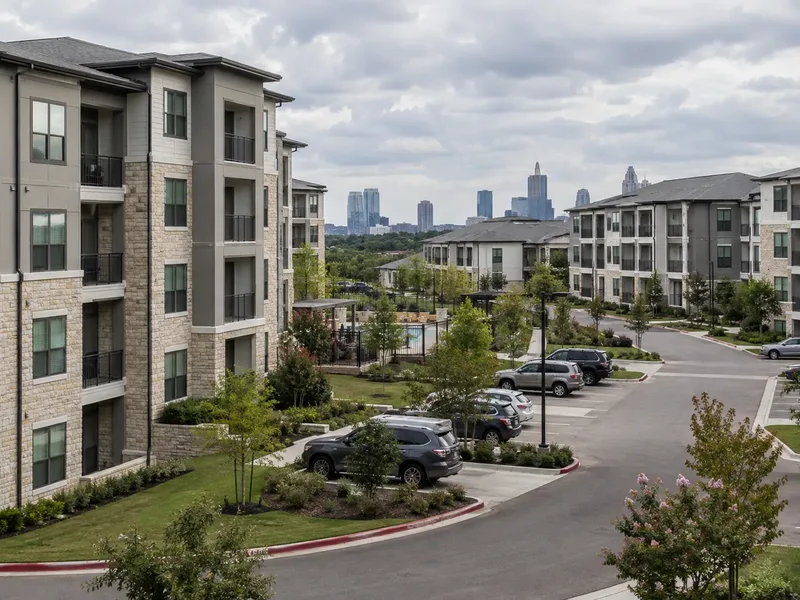
The overall delinquency rate on bank-held multifamily loans slipped modestly in the second quarter of 2026, but the financial damage beneath that figure is worsening.
According to CRE Daily, which cited CRED iQ's analysis of FDIC data covering all insured institutions, annualized net charge-offs (actual loan losses written off by lenders) climbed to 0.32% in Q2 2026, more than double the 0.13% rate recorded for all of 2025.
The headline delinquency figure dropped to 1.41% from 1.47% in Q1 2026, a multi-year peak. Bank multifamily loan portfolios totaled $667.6 billion in Q2, up 3.6% from a year earlier, while the dollar value of delinquent balances fell from $9.78 billion to $9.41 billion.
What Moved and What Did Not
The improvement came almost entirely from early-stage loans. Loans 30 to 89 days past due fell to 0.31% from 0.40%. Loans delinquent 90 or more days rose to 1.10% from 1.07%.
CRED iQ described that combination as consistent with a workout-driven cycle rather than a genuine resolution. Lenders appear to be processing distressed loans through negotiated workouts, clearing early-stage buckets while deeper losses accumulate.
For context, Q2's 1.41% rate is still about 6.7 times the 2019 low of 0.21%, though it remains far below the 5.90% peak reached during the Global Financial Crisis.
Property Cash Flows Under Pressure
CRED iQ separately examined securitized multifamily loans with financials updated as of June 2026, and the property-level picture helps explain why credit conditions remain strained.
At the median property, effective gross income grew just 0.6% while operating expenses rose 1.5%, roughly 2.5 times faster. Net operating income (NOI, the cash left after expenses before debt service) increased only 0.2%.
Expenses outpaced income at 57% of properties in the dataset. Nearly half, 48%, posted an outright NOI decline.
Shrinking NOI matters for borrowers facing loan maturities or rate resets because weaker cash flow leaves less room to meet tighter underwriting standards or absorb higher debt costs when refinancing.
Regional Variation in the Stress
Not all markets are under pressure for the same reasons. San Francisco, Seattle, and Denver showed the sharpest NOI erosion in CRED iQ's securitized property dataset, each combining below-average income growth with above-average expense increases.
Dallas and Austin showed a different pattern. NOI softness in those markets traced more to weak revenue growth than to rising costs, pointing to demand-side conditions rather than an expense problem.
CRED iQ noted that its securitized property data and the FDIC bank-loan figures are separate datasets, so the property trends do not map directly onto the delinquency statistics.
Still, deteriorating NOI across a wide share of properties reduces the financial cushion available to borrowers across both pools.