Being successful in business requires thinking outside the box, identifying sales, and recognizing customer trends. Knowing how your products and services influence the local community offers significant insight into future directions for the company. Heat maps are one analytical tool for companies wanting to collect this valuable information. These pieces of data can help you understand critical components of your business’s functioning. By establishing a graphical representation of the data, new insights emerge.
A heat map helps individuals measure data density within a specific geographic area. The colors on the map represent density, with orange and red commonly used for higher-density areas. Frequently, blue represents lower density data, although individual colors may vary.
Someone wanting to measure a specific geographic area where sales are coming from might use a sales heat map to accomplish this. To determine these components, the user would start by plotting all sales locations within the software. Red areas would represent the areas generating the highest sales, while the blue areas would showcase areas for improvement. After the map generates, apply the heat map to analyze the data.
Although other maps can perform these features, heat maps bring a cleaner appearance and are often more aesthetically pleasing. For instance, pin maps can measure density by marking all data points with a marker. Unfortunately, individual data points can quickly become overwhelming and messy to look at. By using colors for density, heat maps can promptly identify relevant areas.
A heat map offers many different purposes for businesses, primarily when they determine where data is present and where it’s minimal. Heat maps measure a company’s performance within a given area, including several metrics.
Metrics for heat maps may vary but include deliveries, revenue, customers, and sales. For example, a heat map using sales metrics will tell companies where their products are most popular geographically. Feedback can determine which areas to target through advertising. When a business can identify areas that hold high conversion rates, it can increase further sales within the region.
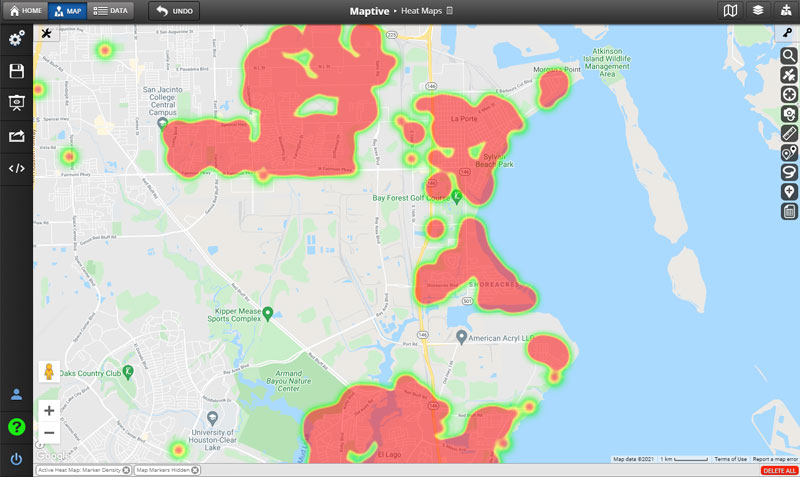
A traditional heat map connects data points with color-coded circles and offers a radius of influence. The densest areas of the circles are typically colored red and will fade to blue or green. The color coding is customizable to suit individual preferences and can be customized according to company colors.
An area-based heat map is ideal if you’re trying to compare data between different geographic locations. This allows a constant comparison of zip codes, states, or counties. This map will integrate geographic areas with colors based on data located there. For instance, high sales in California would suggest a red color. Another state with a lower value might hold a blue color. These maps offer a quick overview of the data within a region.
This heat map is like a dot-density map, with data represented on the map as points. Larger clusters represent high-density areas, while sparse clusters represent lower-density areas. Organizations may add color shades to illustrate further where most of the data is.
While it’s clear that heat maps will directly benefit your business, understanding the key benefits is crucial to your success. Here are two specific benefits of using heat maps within a company:
Valuable information often hides within the countless records, difficult to see until it’s presented visually. Static data like numbers within a spreadsheet only tell a partial story, making spatial representation vital for your company’s growth.
When a company is trying to grow and expand, you’ll need to know which areas of your business are performing well and which sites aren’t. A heat map can identify target areas to focus expansion efforts.
The correct heat map for your project will largely depend on what information you’d like to gather from the map. Always experiment with different heat maps to see which option suits your needs best before committing to a final concept.
Heat maps transform static, numerical data into high-impact visuals that tell the story of your business. They can help you understand key metrics for sales and optimize growth strategies moving forward. The more insight from your current position, the better suited your company will be now and in the future.